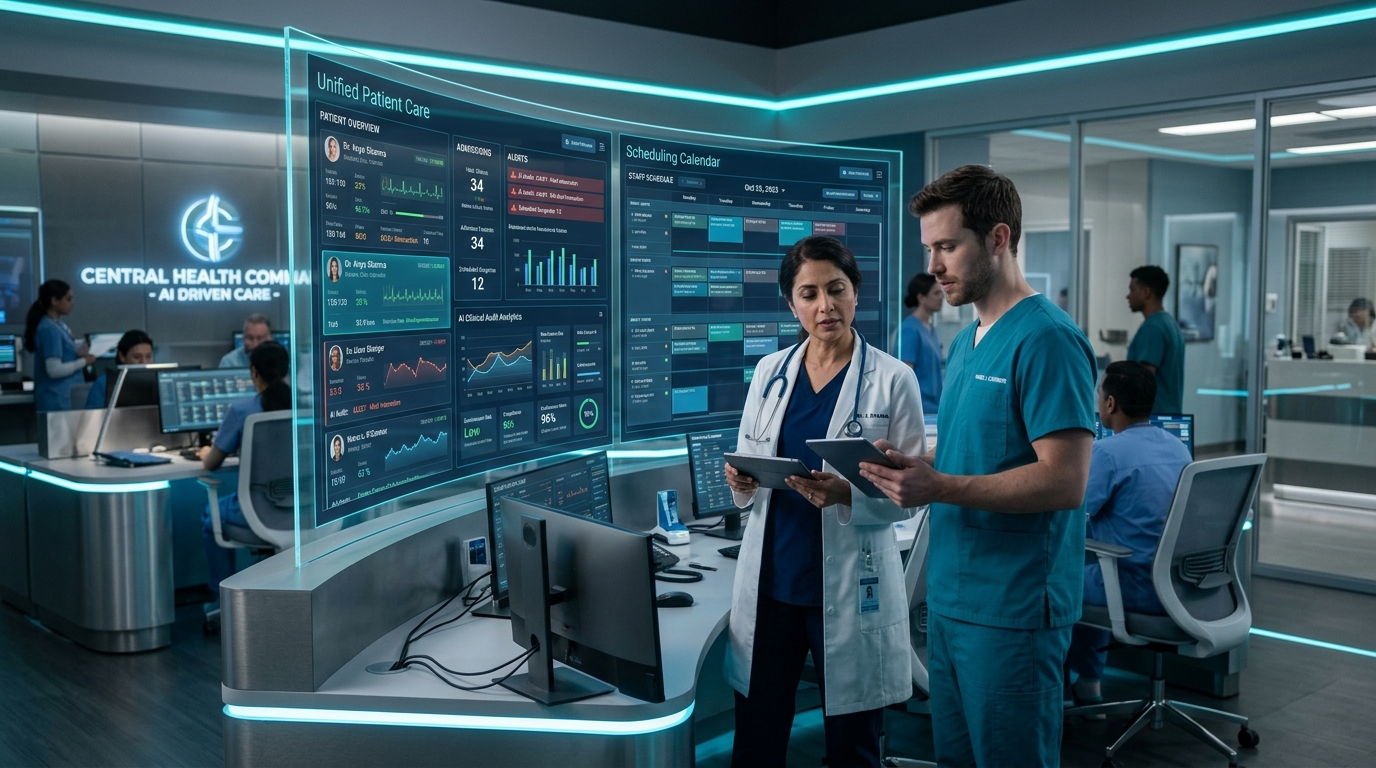
Closed-Loop Clinical Decision Support (CDSS): Next-Generation Sepsis Telemetry and Early Deterioration Prediction at the Bedside
Sepsis remains one of the most formidable, lethal challenges confronting inpatient hospital medicine. Defined under the Third International Consensus Definitions (Sepsis-3) as life-threatening organ dysfunction caused by a dysregulated host response to infection, sepsis accounts for more than one in three hospital deaths in the United States and represents the single highest inpatient cost burden, exceeding $38 billion annually.
The pathophysiological progression of septic shock is unforgivingly rapid. For every one hour of delay in administering appropriate broad-spectrum antimicrobial therapy and targeted fluid resuscitation following the onset of septic hypotension, patient survival decreases by approximately 7.6%. Yet, early sepsis is notoriously insidious to detect: its initial clinical symptoms—mild tachycardia, subtle tachypnea, low-grade temperature fluctuations, and slight mental clouding—mimic dozens of benign post-operative or viral conditions.
Historically, hospitals attempted to detect early deterioration through rule-based Electronic Health Record (EHR) alerts based on Systemic Inflammatory Response Syndrome (SIRS) criteria. These first-generation alerts proved to be an unmitigated disaster in practice. Plagued by an abysmal positive predictive value (frequently below 5%), SIRS-based alerts generated hundreds of nuisance notifications per shift. This onslaught triggered severe alert fatigue, leading nurses and physicians to reflexively dismiss warning pop-ups—including the rare alerts that signaled true life-threatening decompensation.
In late 2026, acute care hospitals are deploying Closed-Loop Clinical Decision Support Systems (CDSS) powered by high-frequency continuous physiological streaming telemetry, gradient-boosted decision ensembles, transformer-based temporal trajectory modeling, and automated order-set orchestration.
This technical engineering treatise explores the architectural pipelines, feature engineering mathematics, latency constraints, and clinical validation protocols required to deploy real-time early deterioration and sepsis prediction engines at hospital bedside scale.
1. The High-Frequency Telemetry Ingestion Architecture
Traditional EHR-based clinical decision support operates on low-frequency, episodic batch data. In standard Med-Surg or Stepdown units, vital signs are manually recorded by nursing staff every four to eight hours. If a patient begins to decompensate at 10:15 AM, the EHR database remains blind to that deterioration until the next scheduled vital sign round at 2:00 PM—a diagnostic lag that often proves fatal.
Modern closed-loop CDSS engines bypass manual documentation by tapping directly into high-frequency medical device telemetry streams.
| HIGH-FREQUENCY BEDSIDE TELEMETRY STACK |
|---|
| [Bedside Hardware Interface]: Continuous ECG waveforms (250–500 Hz) |
| Continuous Photoplethysmography (PPG: 60–100 Hz) |
| Arterial Line Blood Pressure & Capnography (EtCO2) |
| [Device Integration Gateway]: Capsule / Philips IntelliBridge / HL7 IHE PCD-01 |
| Sub-second real-time serial-to-IP extraction |
| [Streaming Telemetry Bus]: Apache Kafka / Redpanda Distributed Event Bus |
| Partitions telemetry streams by Bed / Unit ID |
| Throughput: > 500,000 physiological msgs/second |
| [Edge Feature Extractor]: Apache Flink Stateful Stream Processing Engine |
| Continuous sliding-window statistical features |
| HRV, Pulse Pressure Variation, Shock Index |
The Power of Continuous High-Frequency Waveforms
Continuous physiological waveforms contain rich hemodynamic signals completely invisible on manual intermittent spot-checks:
- Heart Rate Variability (HRV): Spectral decomposition of continuous R-R intervals reveals autonomic sympathetic-vagal balance. Systemic endotoxemia dampens vagal tone, causing an abrupt loss of high-frequency HRV hours before gross tachycardia develops.
- Continuous Shock Index (CSI): Calculated continuously as heart rate divided by systolic blood pressure (
CSI = (HR) / (SBP)). While an isolated heart rate of 98 bpm and blood pressure of 105/65 mmHg appear superficially normal, a Shock Index $> 0.9$ signals impending occult hypoperfusion. - Photoplethysmography (PPG) Pulse Amplitude Index: Peripheral microvascular vasoconstriction driven by early neuroendocrine compensation attenuates peripheral pulse wave amplitude long before central blood pressure collapses.
2. Advanced Feature Engineering: Modeling Non-Linear Sepsis Kinetics
Raw physiological signals alone are insufficient to distinguish true sepsis from clean post-operative recovery, vigorous physical therapy, or benign medication responses.
The CDSS feature engineering engine models the multi-dimensional trajectory of patient physiology over time, assembling over 120 dynamic variables:
Multi-Dimensional CDSS Feature Vector
>
Dynamic Vital Sign Trajectories:
• Slope of Respiratory Rate over 4 hours:
d(RR) / dt• Minimum Mean Arterial Pressure (MAP) nadir over 6 hours
• Shock Index Delta:
ΔCSI = CSI(t) - CSI(t - 2 hr)
>
Laboratory Kinetics & Biomarkers:
• Serum Lactate Clearance Dynamics:
(Lactate_t - Lactate_{t-4}) / 4 hr• Bandemia & Immature Granulocyte Ratio:
Bands / Total Neutrophils• Thrombocytopenia Velocity: Rate of platelet count decline per 24 hours
• Acute Kidney Injury Index: Delta creatinine relative to baseline
>
EHR Contextual & Nursing Documentation:
• Active broad-spectrum IV antibiotic administration status
• Indwelling invasive line presence (Central Venous Catheter, Foley, ETT)
• Modified SOFA (Sequential Organ Failure Assessment) score trajectory
The Sepsis-3 SOFA Score Transformation
The algorithm tracks the acute change in baseline Sequential Organ Failure Assessment (SOFA) score across six organ systems:
Δ SOFA(t) = SOFA_{current}(t) - SOFA_{baseline} | Organ System | Dynamic Telemetry Biomarker Evaluated |
|---|---|
| Respiration | PaO2 / FiO2 ratio (or non-invasive SpO2/FiO2 surrogate) |
| Coagulation | Platelet count (\times 10^3 / \mu L) |
| Liver | Total Bilirubin concentration (mg/dL) |
| Cardiovascular | Continuous Mean Arterial Pressure (MAP) & Vasopressor ug |
| Central Nervous | Glasgow Coma Scale (GCS) or Richmond Agitation Score (RASS |
| Renal | Serum Creatinine (mg/dL) & Hourly Urine Output (mL/hr) |
An acute increase in total SOFA score of ge 2 points attributable to infection serves as the mathematical definition of organ dysfunction under Sepsis-3 guidelines.
3. Machine Learning Architectures: From GBDT to Temporal Transformer Models
The predictive core of modern CDSS combines Gradient Boosted Decision Trees (XGBoost / LightGBM) with Recurrent Temporal Transformers (TST) operating in an ensemble configuration.
| ENSEMBLE SEPSIS PREDICTION ARCHITECTURE |
|---|
| ENSEMBLE META-LEARNER (BAYESIAN STACKING REGRESSOR) |
| Combines Model A + Model B outputs into Calibrated Probability |
| Output: Continuous Risk Score R(t) \in [0.0, 1.0] |
Addressing Clinical Class Imbalance
True sepsis decompensation occurs in only $2\% - 5\%$ of general ward admissions. Training machine learning models on highly imbalanced data typically causes algorithms to default toward predicting the majority negative class.
Modern CDSS architectures overcome this via Focal Loss Optimization:
L_{focal}(p_t) = -α_t (1 - p_t)^γ ln(p_t) Where:
p_trepresents the model's estimated probability for the ground-truth class.gammais the focusing parameter (typicallygamma = 2.0), which dynamically down-weights easy-to-classify healthy patient examples, forcing the neural network to focus training capacity on ambiguous, borderline decompensation cases.- Calibrating decision thresholds via Isotonic Regression guarantees that a predicted score of $0.80$ corresponds to an exact empirical 80% probability of true clinical deterioration.
4. Closing the Loop: Orchestrating Actionable Interventions and Order Sets
The most common failure mode of clinical AI is delivering a passive alert without an actionable clinical pathway. An algorithm that flashes *"Sepsis Risk 82%"* on a monitor simply creates anxiety and cognitive friction for busy clinical staff.
A Closed-Loop CDSS pairs predictive intelligence with automated clinical orchestration:
| CLOSED-LOOP CLINICAL ORCHESTRATION STACK |
|---|
| [Step 1: Bedside Nurse Notification via Mobile VoIP (Vocera / Epic Rover)]: |
| Silent vibration alert: "Bed 14 Sepsis Deterioration Index 0.82" |
| Displays SHAP Waterfall explanation: Tachypnea + Shock Index + Elevated Lactate |
| [Step 2: Automated Pre-Staged Order Set Generation (CMS SEP-1 Bundle)]: |
| Pre-populates EHR order set for Attending Physician approval: |
| - STAT Serum Lactate Draw (LOINC 2524-7) |
| - Blood Cultures x2 sets before antibiotics (LOINC 600-7) |
| - Broad-Spectrum IV Antimicrobial Order (Vancomycin + Cefepime) |
| - Crystalloid Fluid Bolus (30 mL/kg for hypotension or lactate >= 4.0) |
| [Step 3: Rapid Response Team (RRT) Dispatch]: |
| If untreated after 15 minutes, automatically notifies RRT Intensive Care Nurse |
| for bedside clinical evaluation. |
Transparent Explainability via SHAP (Shapley Additive Explanations)
Clinicians refuse to trust black-box models. Whenever the CDSS triggers an alert, it provides an instantaneous SHAP Waterfall Plot explaining the top clinical drivers behind the prediction:
- *Feature 1*: Respiratory rate accelerated from 16 to 26 breaths/min over 3 hours ($+28\%$ risk contribution).
- *Feature 2*: Shock Index widened from 0.72 to 1.05 ($+24\%$ risk contribution).
- *Feature 3*: Peripheral pulse pressure narrowed by 14 mmHg ($+18\%$ risk contribution).
- *Feature 4*: History of immunosuppression / active chemotherapy ($+12\%$ risk contribution).
This transparent, objective breakdown allows the clinician to validate the model's reasoning in under five seconds, bridging the trust deficit between artificial intelligence and human clinical judgment.
5. Comprehensive CDSS Sepsis Architecture Comparison Matrix
The table below contrasts first-generation rule-based alerts against the closed-loop predictive AI telemetry platform engineered by EA Horizon:
| Operational Metric | Legacy SIRS Rule-Based Alerts | Standard EHR Sepsis Tools (Epic NEWS) | EA Horizon Closed-Loop Telemetry CDSS |
|---|---|---|---|
| Telemetry Ingestion Source | Manual periodic vital sign entries | Periodic vitals + static lab results | Continuous High-Frequency Waveforms (ECG, PPG, Art-Line) |
| Prediction Lead Time | -2.0 Hours (Post-decompensation) | 1.0 – 2.0 Hours prior | 4.5 – 6.0 Hours prior to septic shock onset |
| Area Under the ROC Curve (AUROC) | 0.65 – 0.72 (Poor discrimination) | 0.76 – 0.81 (Moderate) | 0.91 – 0.94 (High diagnostic precision) |
| Positive Predictive Value (PPV) | 4.2% – 7.5% (Severe false alarms) | 12% – 18% | 42% – 54% (Actionable clinical relevance) |
| Alert Fatigue Incidence | Severe (Nurses mute notifications) | High | Low (Calibrated focal loss + silent watchlists) |
| Explainability Architecture | None (Static criteria checkmarks) | Basic alert text | Dynamic Bedside SHAP Factor Contribution Plots |
| Workflow Closing Loop | None (Passive screen banner) | Basic order link | Automated CMS SEP-1 Bundle Staging & RRT Dispatch |
6. Academic Medical Center Case Study: 1,200-Bed Inpatient Deployment
To evaluate the clinical efficacy of closed-loop sepsis surveillance, EA Horizon deployed its predictive CDSS engine across a 1,200-bed quaternary academic health system encompassing 36 inpatient medical-surgical, stepdown, and trauma units.
| 1,200-BED QUATERNARY MEDICAL CENTER DEPLOYMENT |
|---|
| - 48,000 Annual Inpatient Admissions |
| - 36 Inpatient Acute Care Units |
| - Pre-Deployment Sepsis Mortality Rate: 21.4% |
| 12-MONTH MEASURABLE CLINICAL & FINANCIAL OUTCOMES |
| - Time to Antibiotic Administration: Reduced by 84 Min |
| - Inpatient Sepsis Mortality: Plummeted from 21.4% to 14.8% |
| - Net Lives Saved: 184 Preventable Sepsis Deaths Averted |
| - Average ICU Length of Stay: Decreased by 2.1 Days |
| - Annual Operating Cost Reduction: $9.4 Million |
Pre-Deployment Baseline Realities
- Unmanageable Alert Fatigue: The hospital's legacy EHR fired over 480 sepsis pop-up alerts daily across inpatient units. Nurses acknowledged and closed 92% of these alerts in under two seconds without reading the details, treating them as meaningless digital clutter.
- Delayed Antibiotic Delivery: The median time from physiological decompensation to broad-spectrum antibiotic administration was 3.8 hours, well outside the CMS SEP-1 quality window.
- Inpatient Mortality: Inpatient mortality among patients who developed septic shock was 21.4%.
Post-Deployment Clinical Outcomes at 12 Months
- Dramatic Alert Reduction: By replacing broad SIRS thresholds with calibrated machine learning ensembles, total daily alerts plummeted from 480 down to 28 highly targeted, high-probability notifications (a 94% reduction in alert noise).
- Accelerated Intervention Speed: Median time to antibiotic administration dropped from 3.8 hours down to 54 minutes, with 88% of alerted patients receiving full blood cultures and fluid resuscitation within one hour of notification.
- Measurable Lives Saved: Inpatient sepsis mortality dropped from 21.4% down to 14.8%, directly averting 184 preventable patient deaths over the 12-month period.
- Economic Value: By preventing progression to multi-organ failure requiring prolonged mechanical ventilation and renal replacement therapy, average ICU length of stay dropped by 2.1 days, generating $9.4 million in net hospital operating cost savings.
7. Strategic Implementation Roadmap for Chief Medical Information Officers
For healthcare systems deploying clinical decision support systems in 2026, EA Horizon outlines five non-negotiable architectural mandates:
- Ingest Real-Time Device Waveforms: Do not rely on intermittent manual vital sign documentation. Connect bedside telemetry monitors directly into streaming data buses (Kafka/Redpanda) via HL7 IHE PCD-01 interfaces.
- Eliminate Legacy SIRS Alerts: Retire binary SIRS rules. Replace them with calibrated, gradient-boosted decision trees and temporal transformers trained with focal loss to maintain Positive Predictive Value $> 40\%$.
- Mandate Bedside Explainability: Never deliver an un-grounded black-box probability. Always provide clinicians with transparent SHAP feature attributions that explain exactly why the algorithm raised the alarm.
- Automate the Intervention Loop: Couple alert generation directly to pre-staged CMS SEP-1 order sets (STAT lactate, blood cultures, crystalloid fluids, antibiotics) that require only one-click clinician confirmation.
- Establish Rapid Response Team Integration: Configure automated secondary escalation ladders that alert dedicated Rapid Response Teams if bedside treatment is not initiated within 15 minutes of a validated high-risk alert.
By harmonizing high-frequency physiological streaming telemetry, machine learning precision, and automated clinical order orchestration, closed-loop clinical decision support empowers hospital care teams to intercept septic decompensation hours before shock sets in, transforming acute hospital wards into proactive, life-saving care environments.